I’ve always been quite fond of the colors used in the spectral frequency display of Adobe Audition. It looks quite pretty and the colors are also very helpful in discerning small differences in intensity.
Recently, I came across a fascinating presentation about the work behind some new colormaps for Matplotlib. They set out to develop some colormaps that are colorful, pretty, sequential, perceptually uniform, black-and-white compatible and accessible to colorblind viewers. The video also includes a fascinating crash course in color theory. Highly recommended.
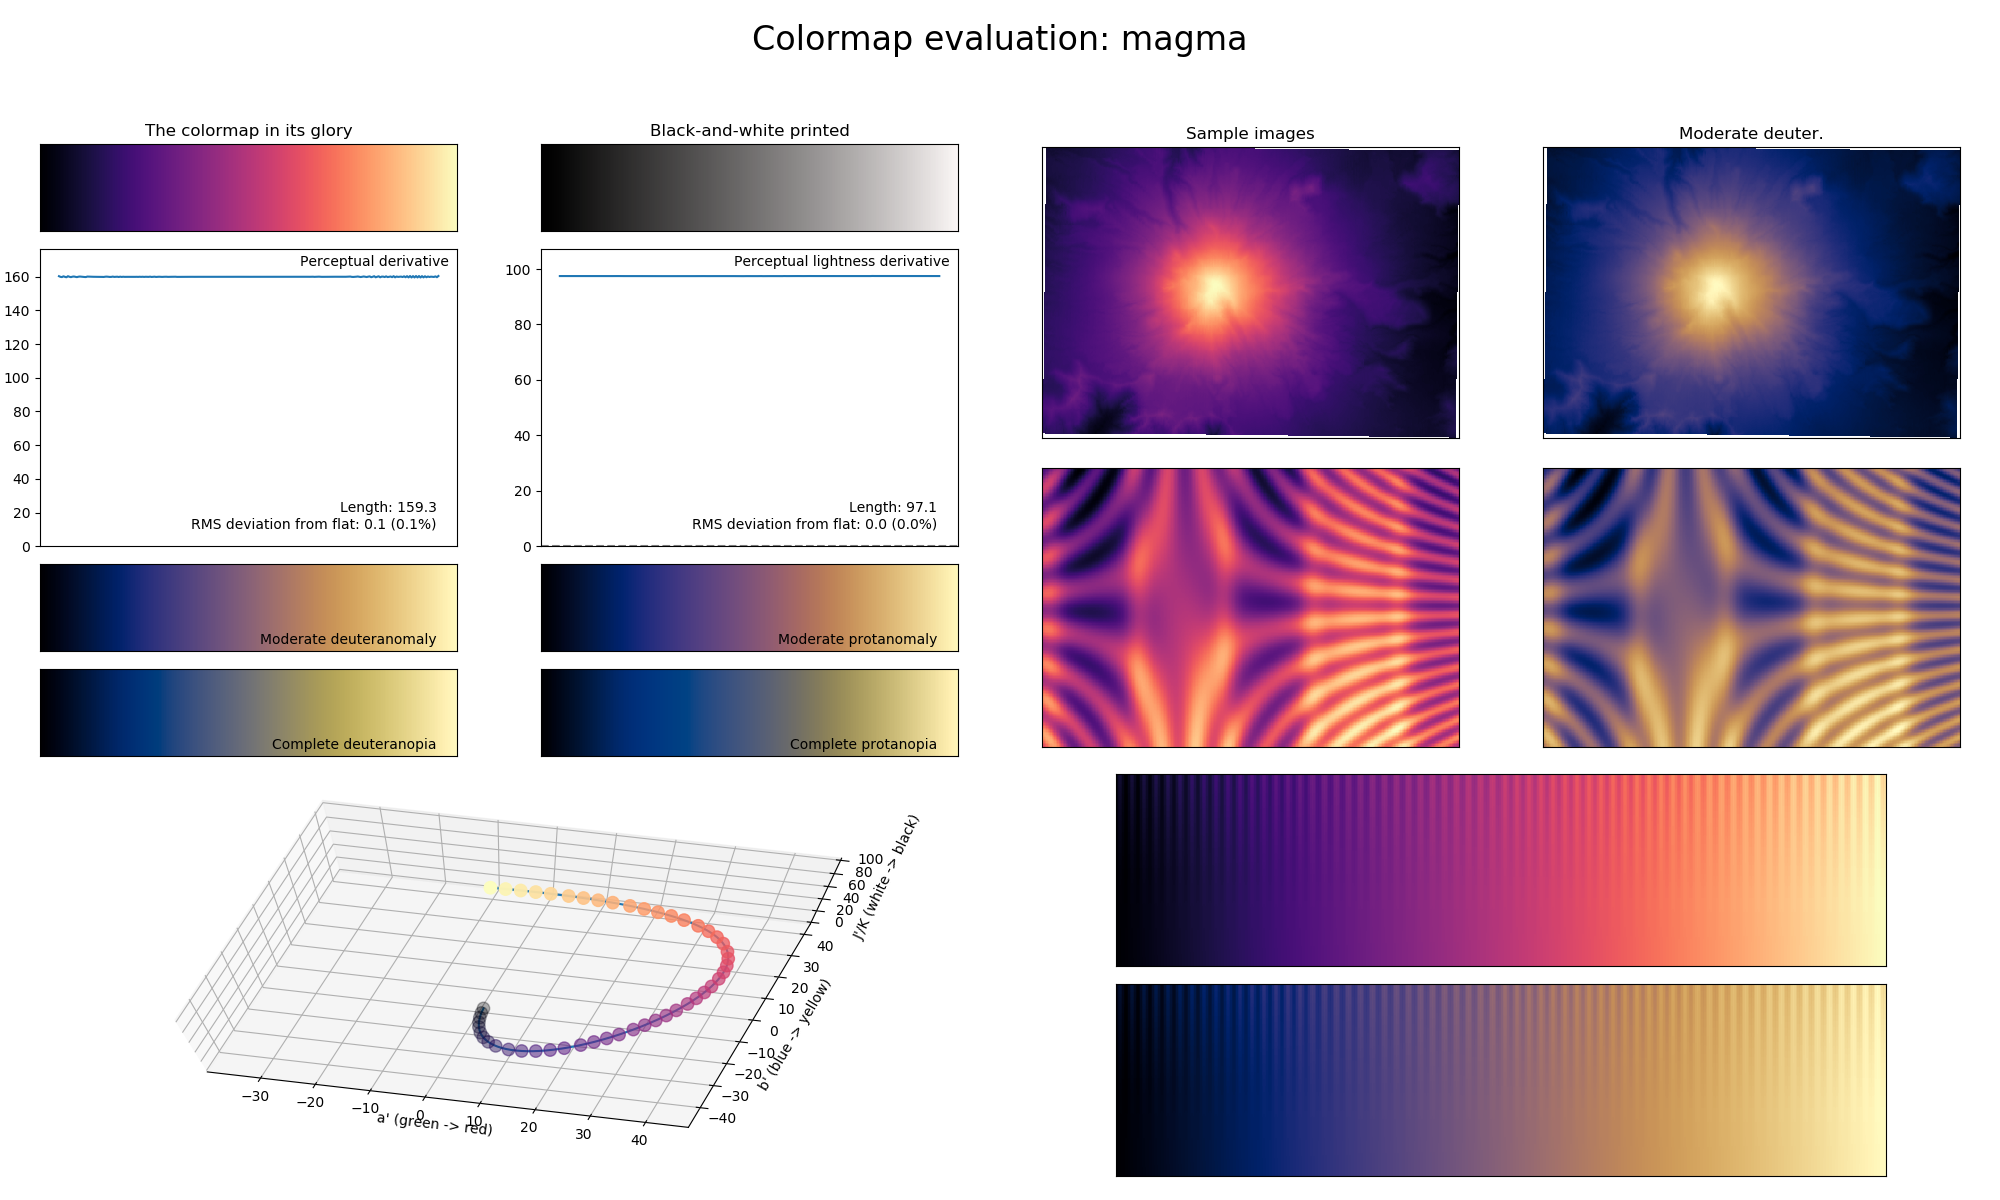
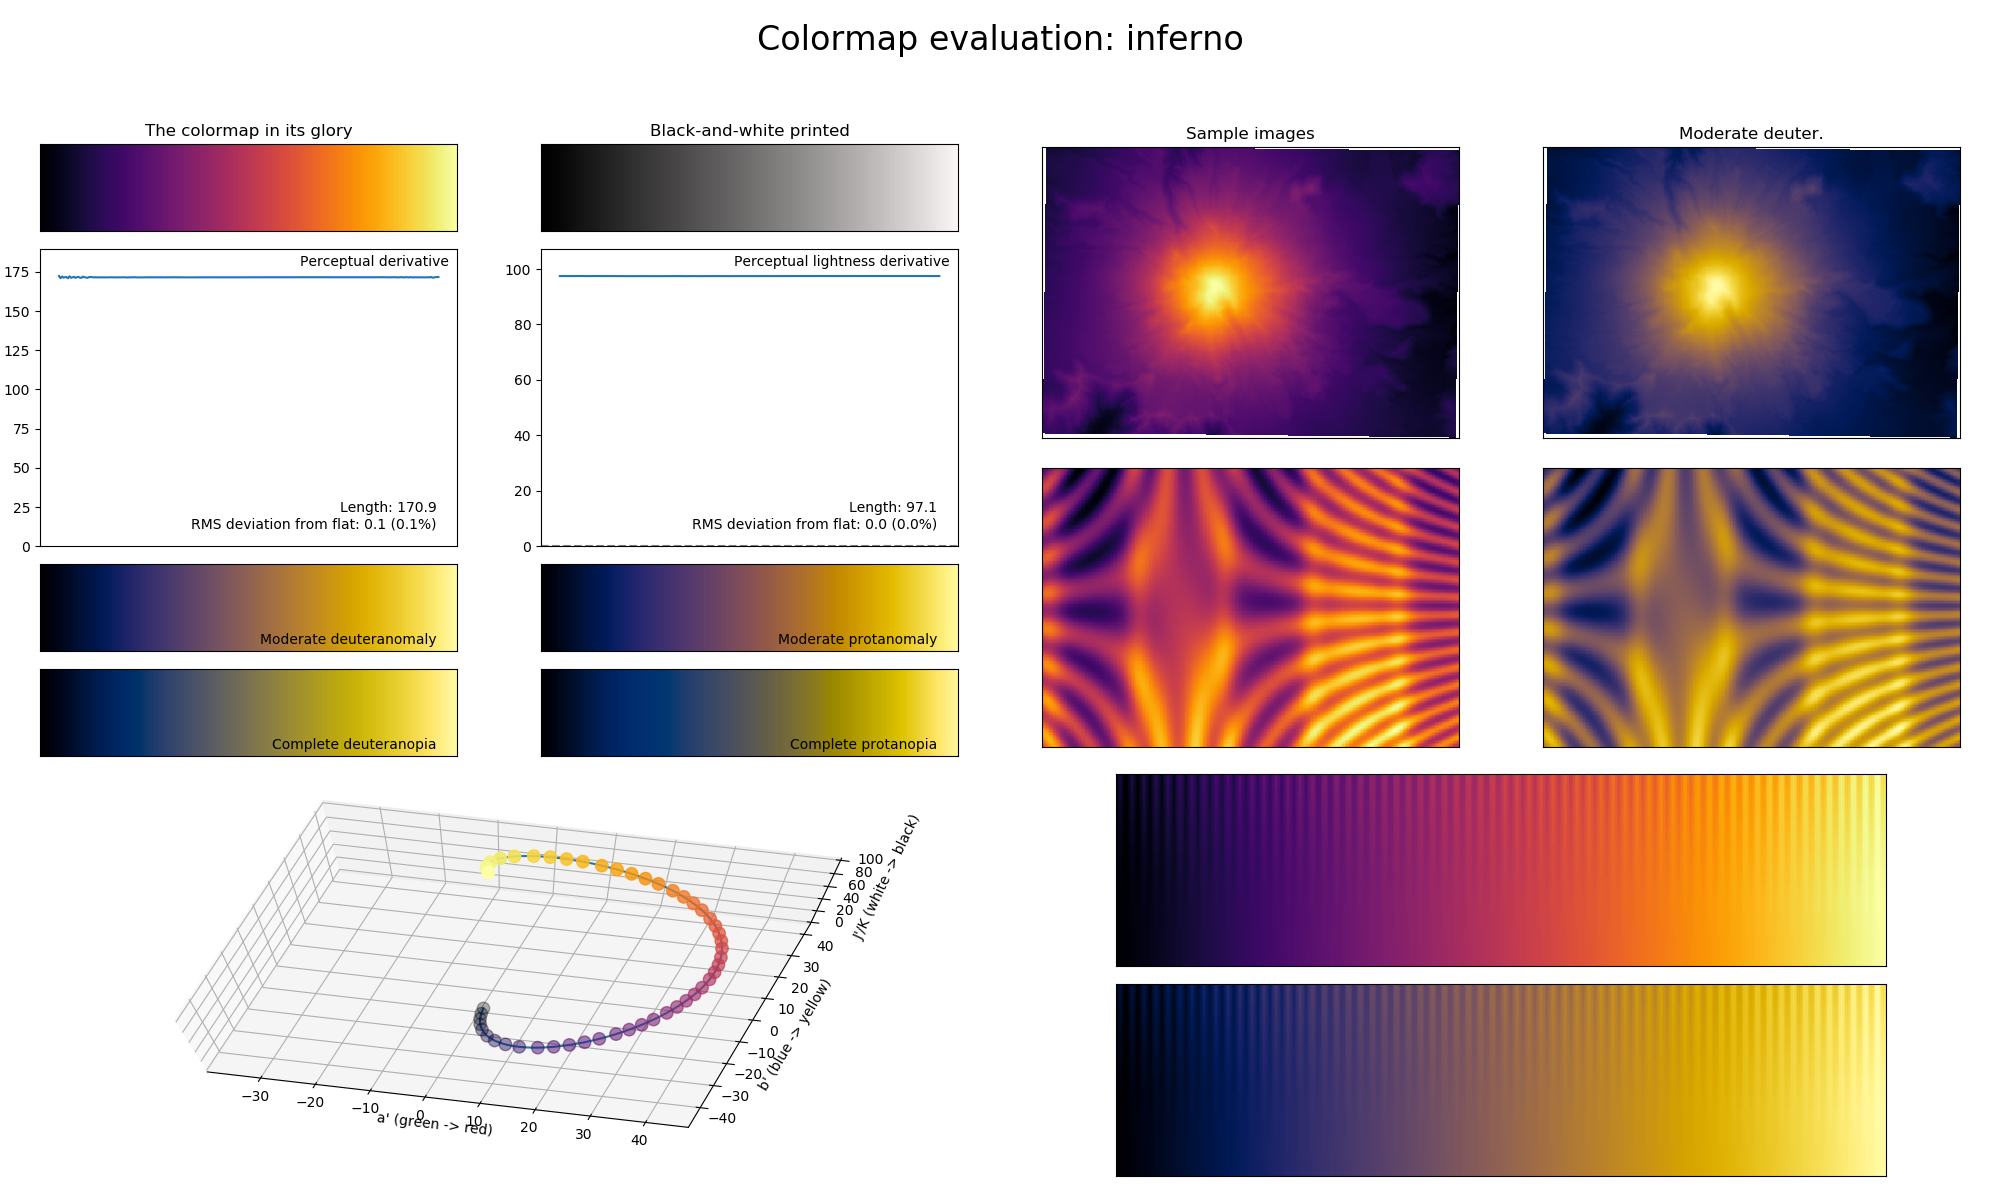
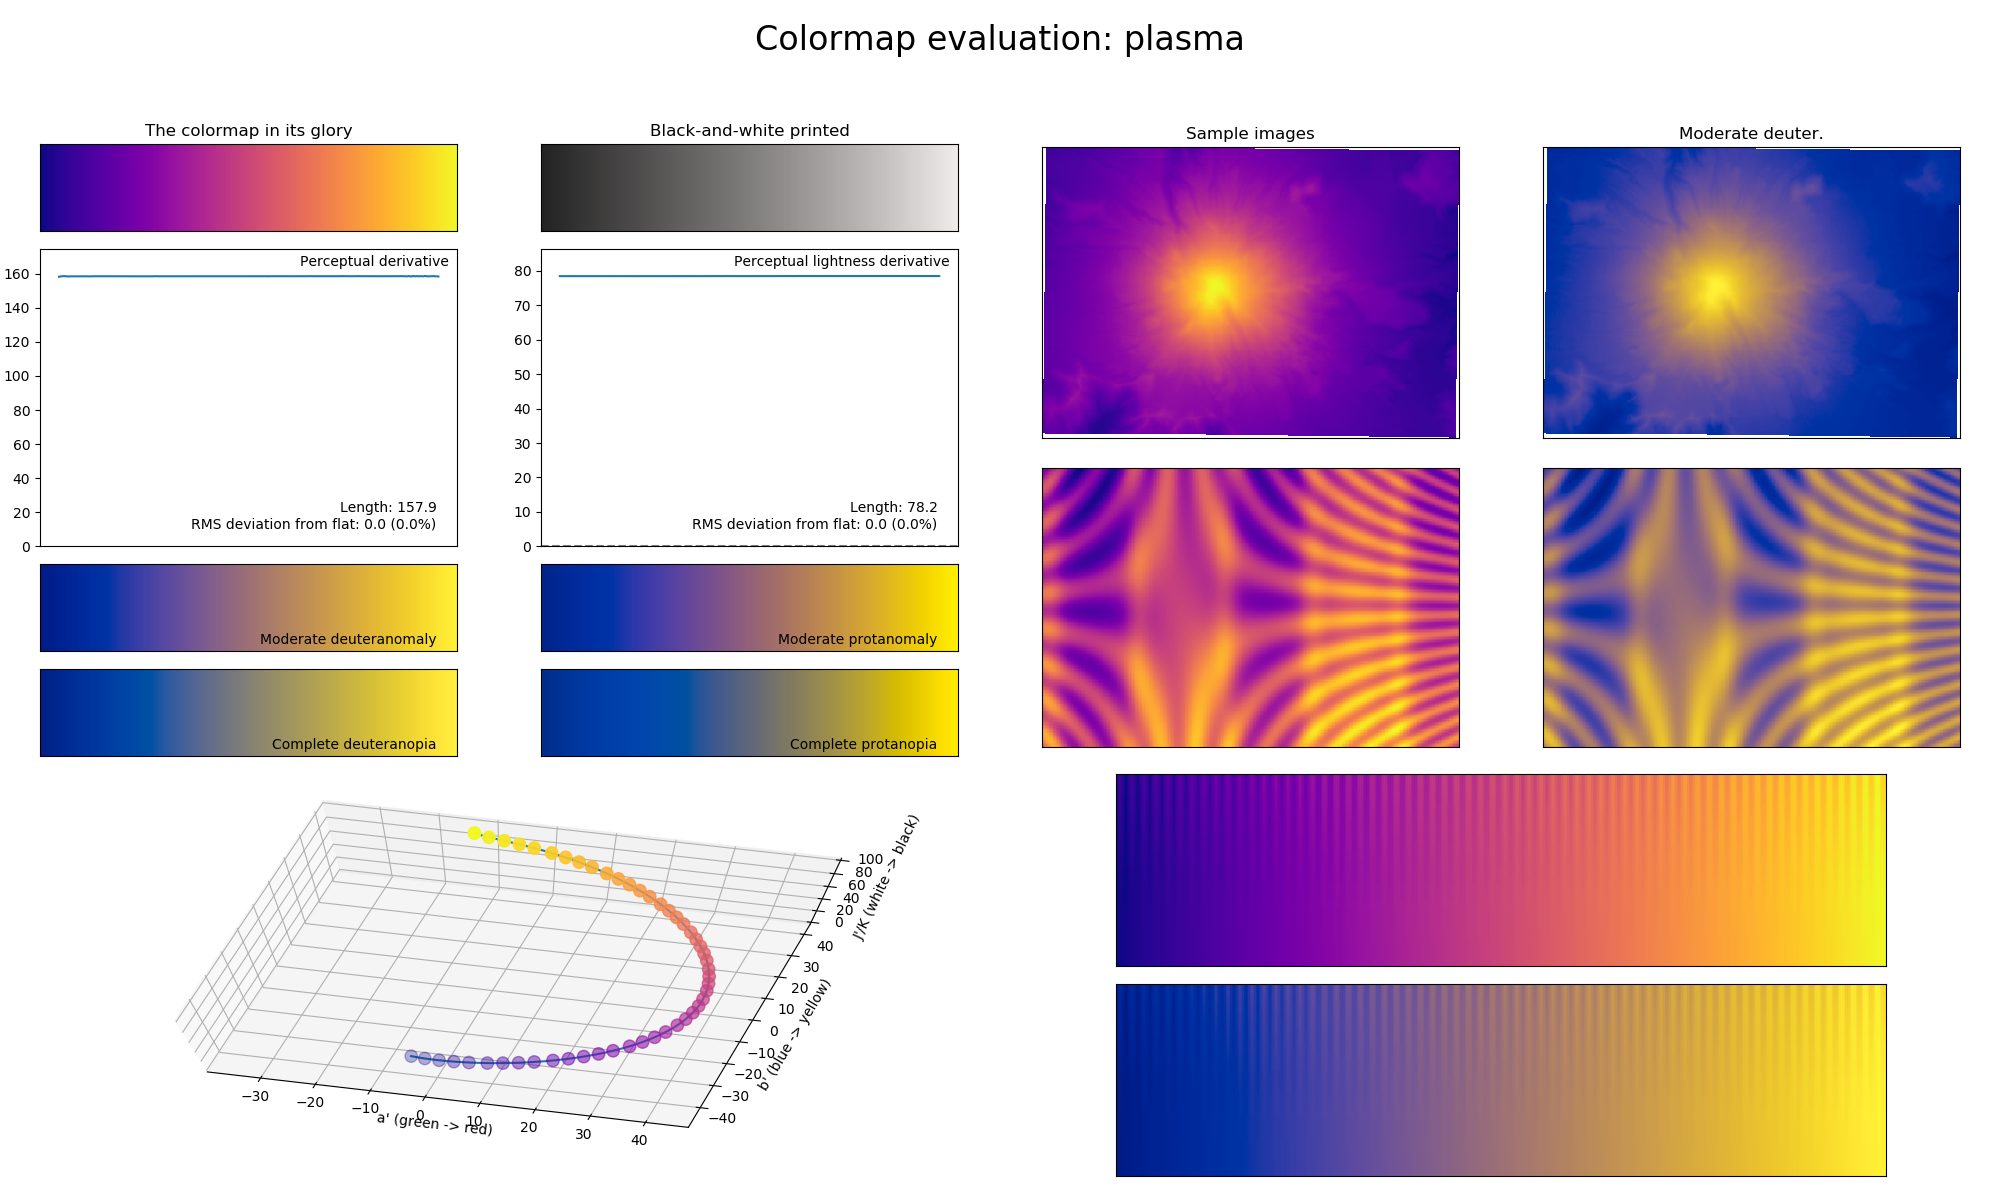
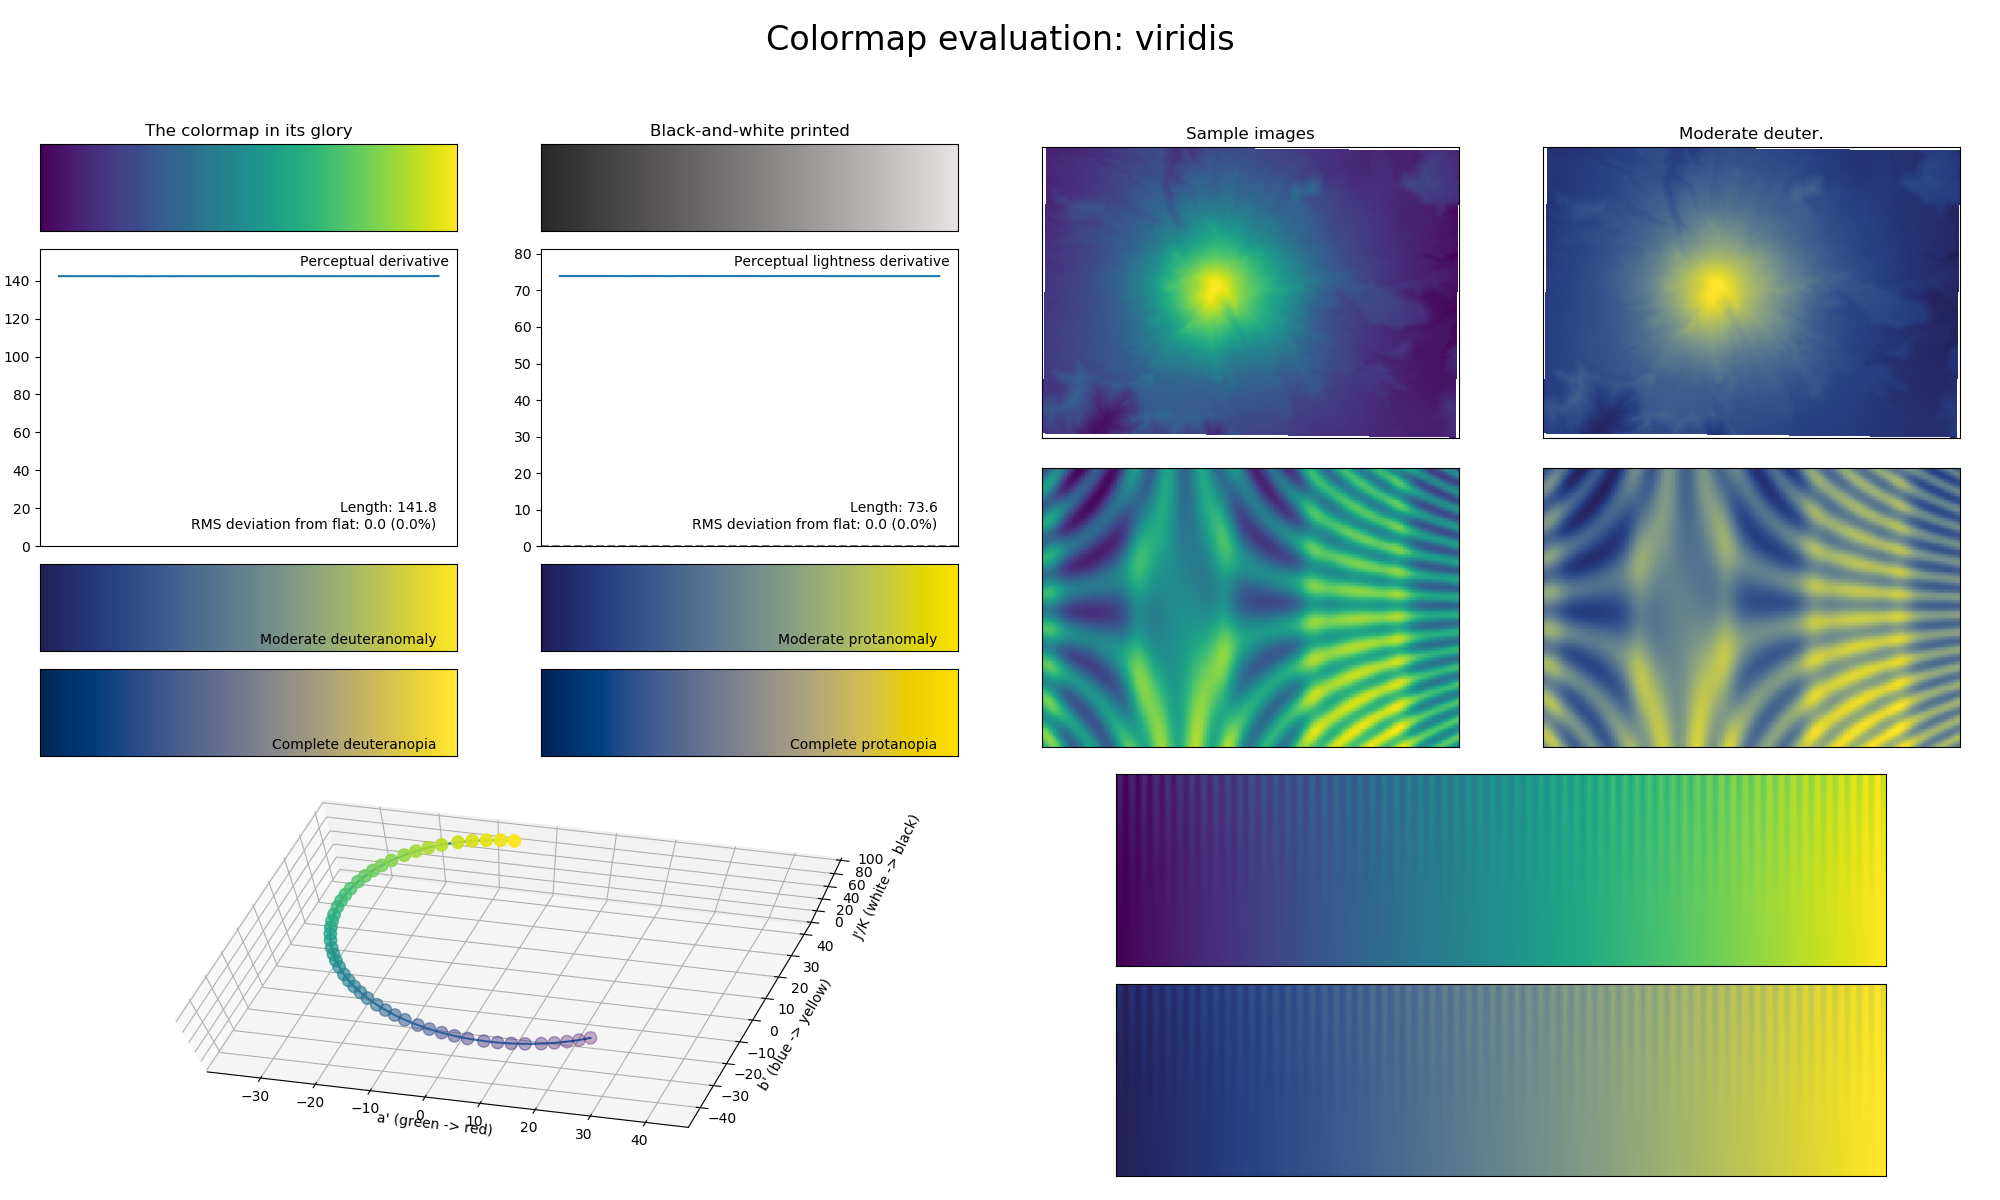
The colormaps magma, inferno, plasma and viridis and the tools colorspacious and viscm that they developed are described here and here. These colormaps, now included beside many others in Matplotlib, are visualized below.
python -m viscm view magma --save magma.png --quit --uniform-space buggy-CAM02-UCS
python -m viscm view inferno --save inferno.png --quit --uniform-space buggy-CAM02-UCS
python -m viscm view plasma --save plasma.png --quit --uniform-space buggy-CAM02-UCS
python -m viscm view viridis --save viridis.png --quit --uniform-space buggy-CAM02-UCS
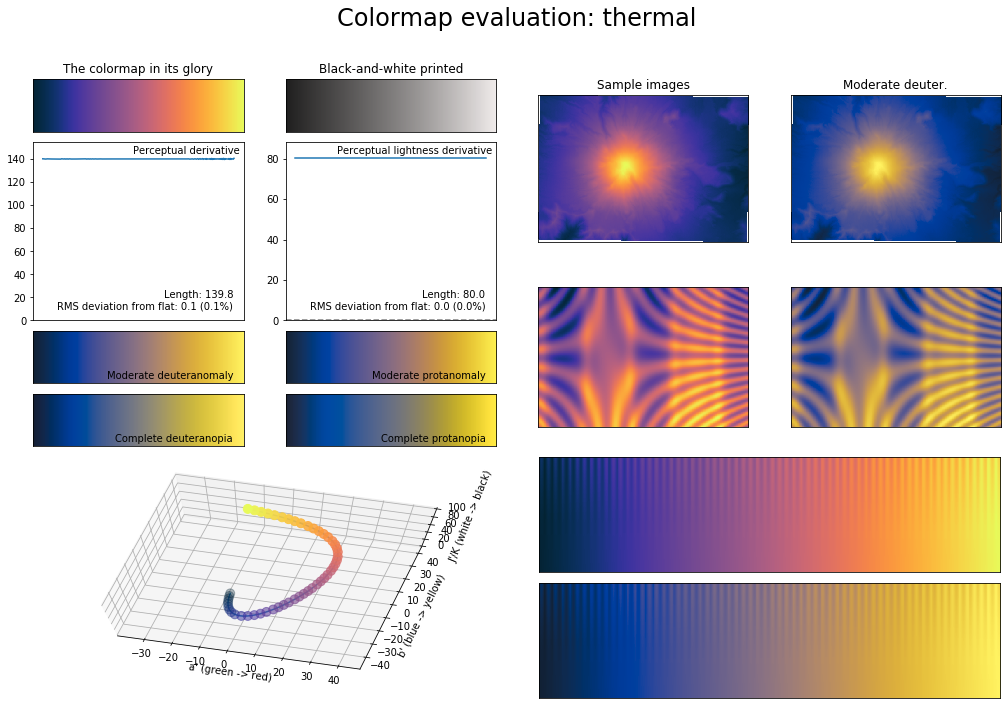
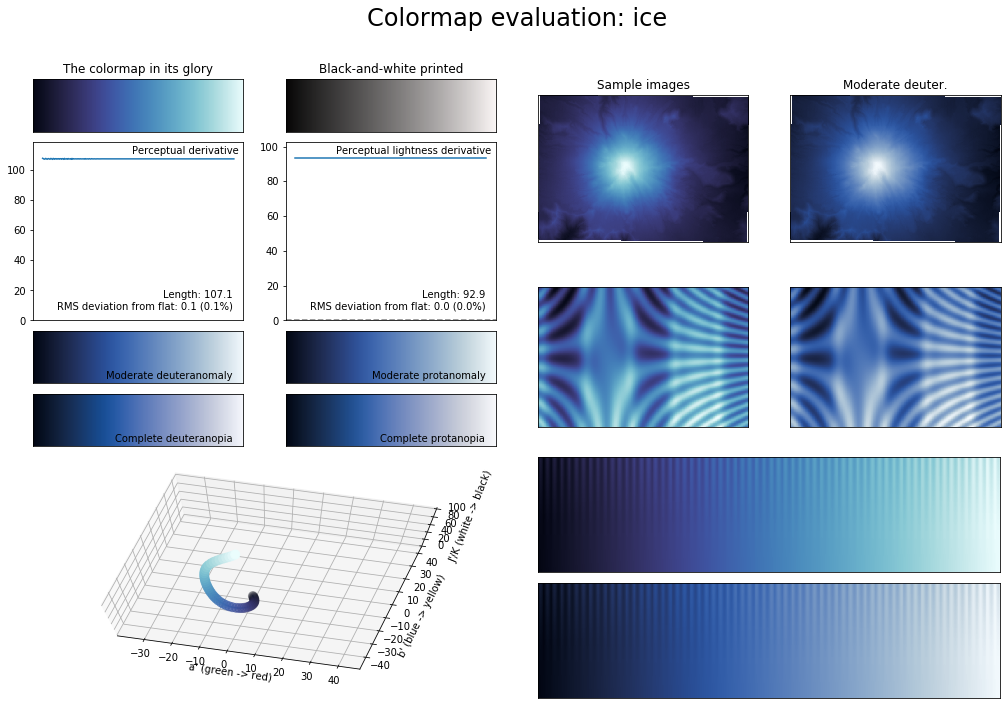
I also found some quite pretty colormaps in the cmocean package, such as thermal and ice.
from viscm import viscm
import cmocean
viscm(cmocean.cm.thermal)
from viscm import viscm
import cmocean
viscm(cmocean.cm.ice)
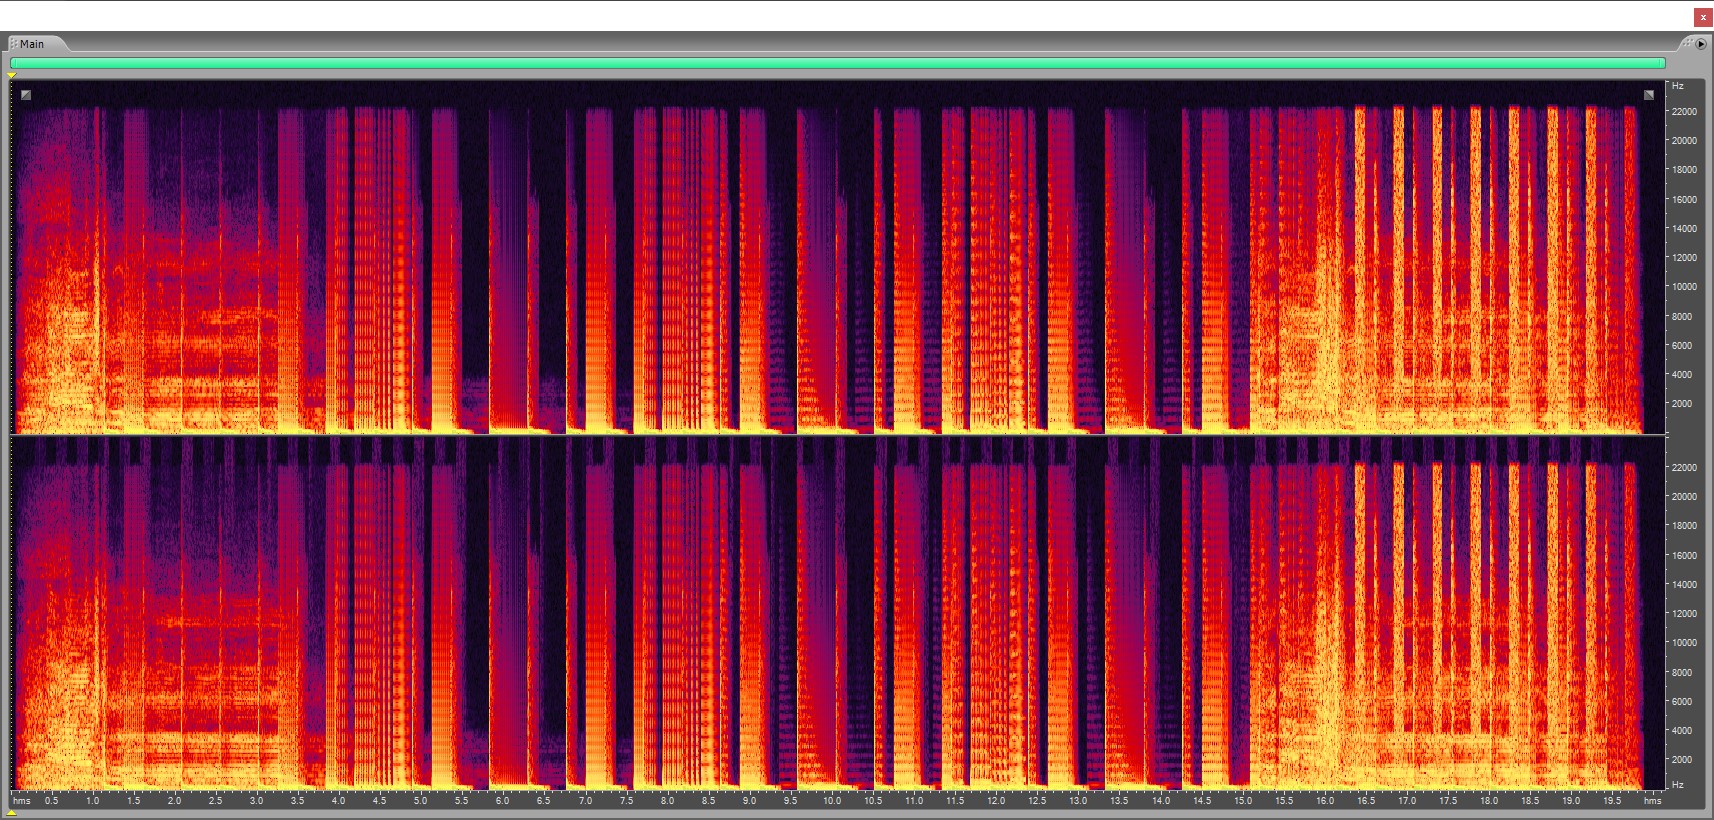
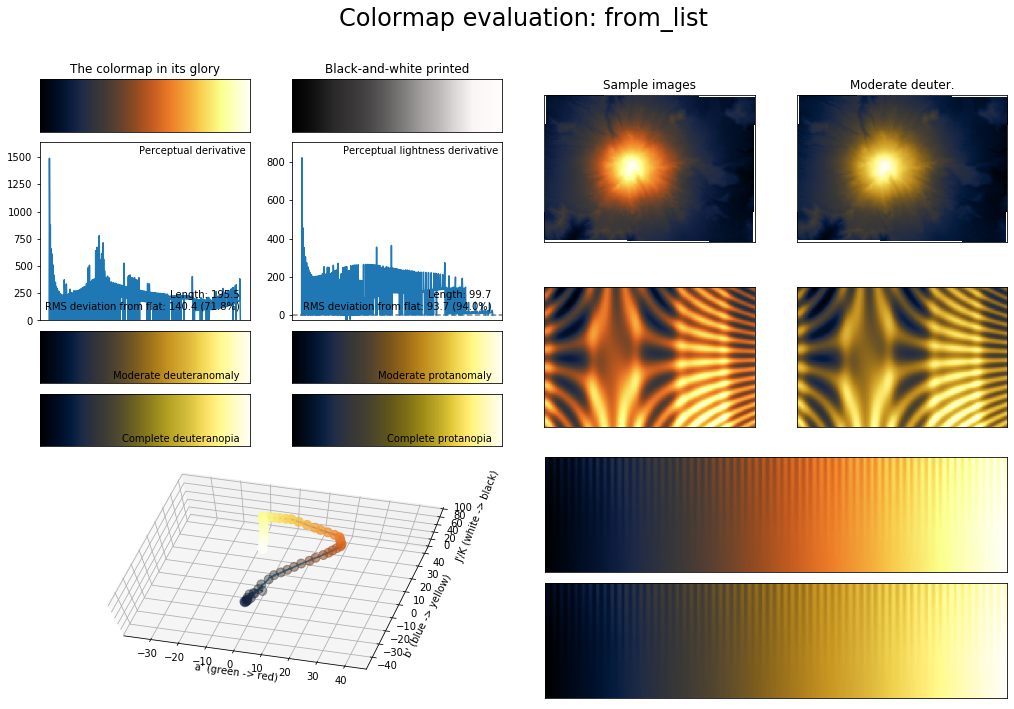
Returning to the colors used in the spectral frequency display of Adobe Audition, I wanted to evaluate this colormap in the same tool as above. So I made a sine wave at 1125 Hz so that it would align nicely with one of the center frequencies of the FFT. I then applied an exponential decay from 0 dBFS to -150 dBFS to capture the full range of the colormap. A screenshot of a zoom-in of this frequency looks like this.

Running viscm on one of the horizontal lines in the middle of this yields the following.
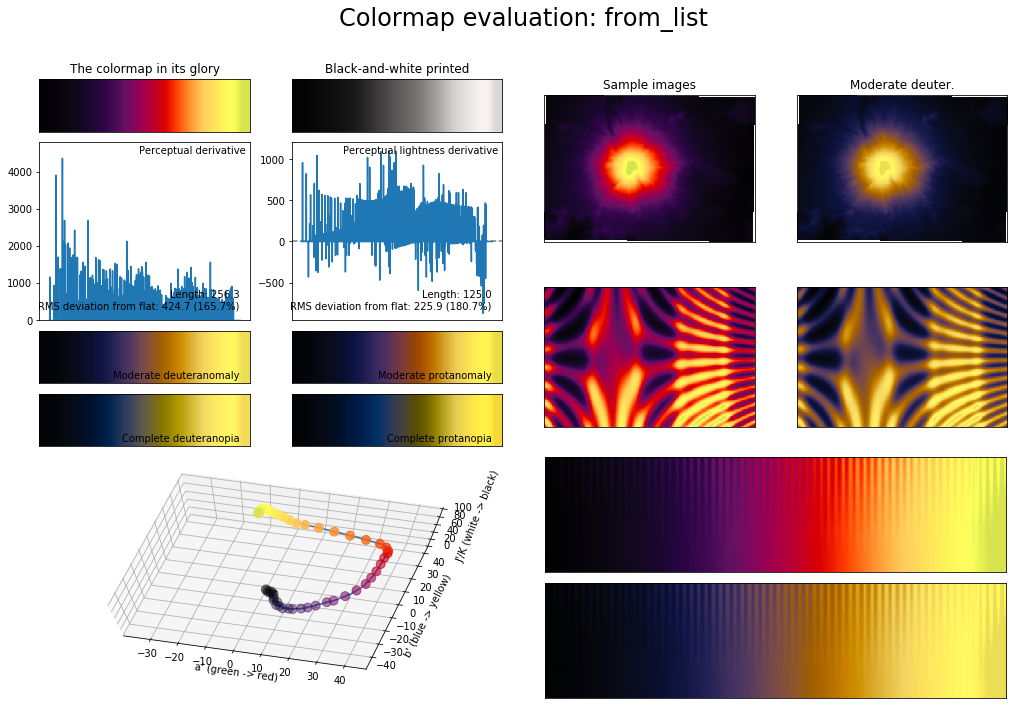
Perhaps this colormap is pretty, but maybe not really as good as I thought it was. I did use an older version of Adobe Audition so perhaps newer versions use a more perceptually uniform colormap.
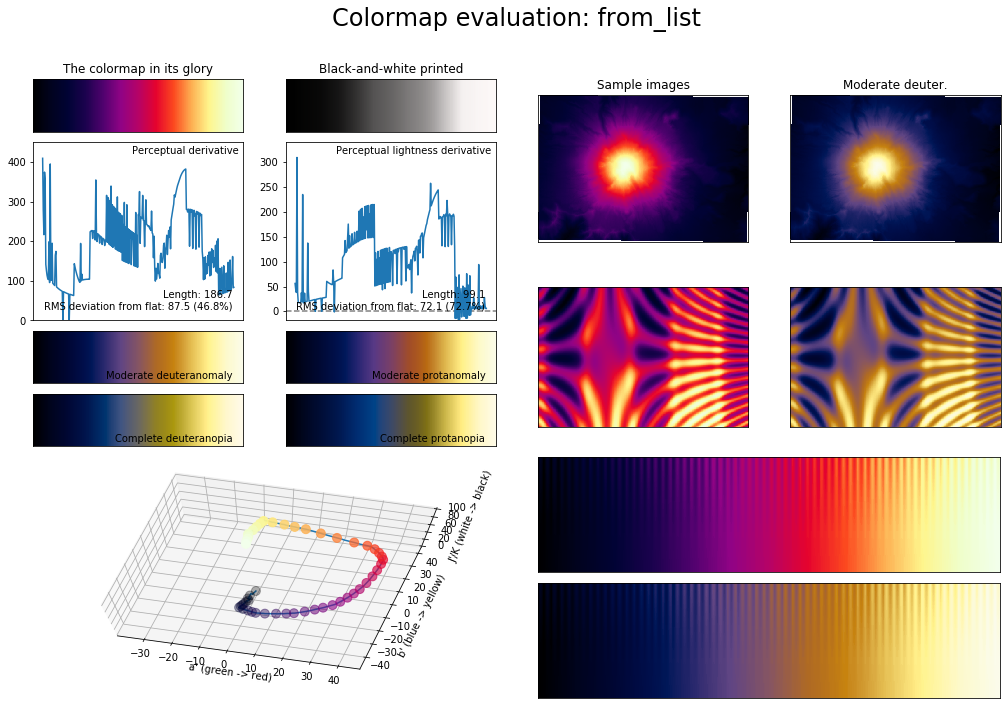
I also own a copy of iZotope RX 7 and applying a similar analysis on the colormap used in this software yields the following.
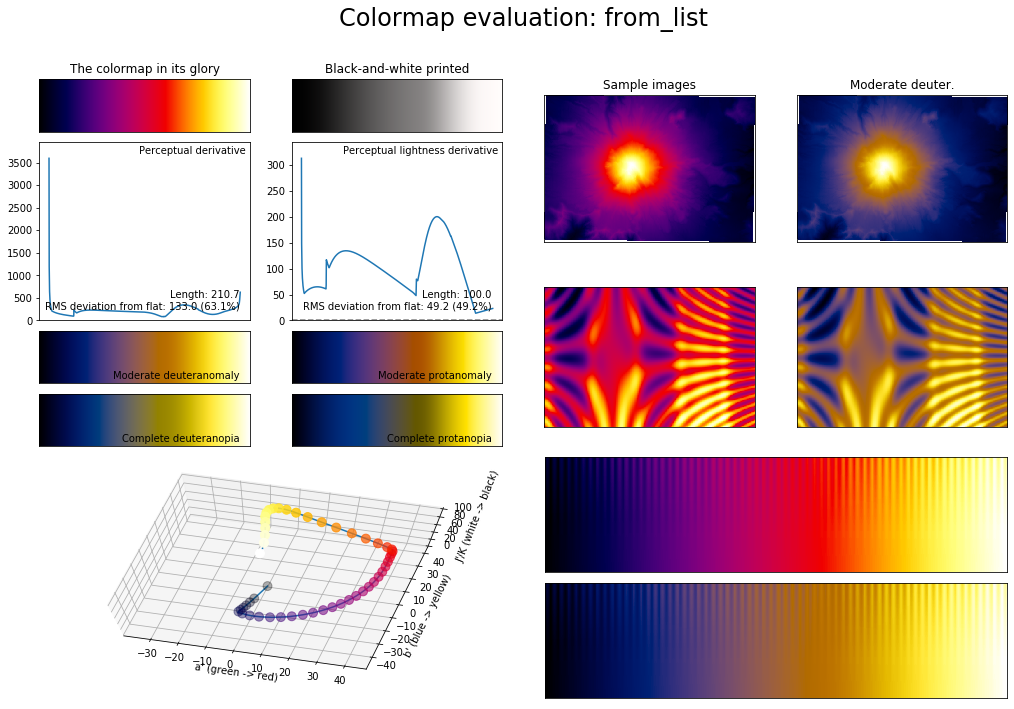
A colormap that looks similar to the one in Adobe Audition, but a little different and I guess a little better, is the one used at https://src.infinitewave.ca/. (This site I highly recommend for their many comparisons of sample rate converters.)
Finally, another colormap similar to both the one in Adobe Audition and the one used at https://src.infinitewave.ca/ is the main one used by SoX - Sound eXchange. It is described in the source code as well as below.
$ R = \cases{ 0 & \text{if } \quad 0.00 \le x \lt 0.13 \cr \sin \left( { {x - 0.13} \over 0.60 }{ \pi \over 2 } \right) & \text{if } \quad 0.13 \le x \lt 0.73 \cr 1 & \text{if } \quad 0.73 \le x \le 1.00 } $
$ G = \cases{ 0 & \text{if } \quad 0.00 \le x \lt 0.60 \cr \sin \left( { {x - 0.60} \over 0.31 }{ \pi \over 2 } \right) & \text{if } \quad 0.60 \le x \lt 0.91 \cr 1 & \text{if } \quad 0.91 \le x \le 1.00 } $
$ B = \cases{ {1 \over 2} \sin \left( { x \over 0.60 } \pi \right) \ \ & \text{if } \quad 0.00 \le x \lt 0.60 \cr 0 & \text{if } \quad 0.60 \le x \lt 0.78 \cr {x - 0.78} \over 0.22 & \text{if } \quad 0.78 \le x \le 1.00 } $
where $R$, $G$ and $B$ are the intensities of the colors red, green and blue and $0 \le x \le 1$ is the position on the colormap.
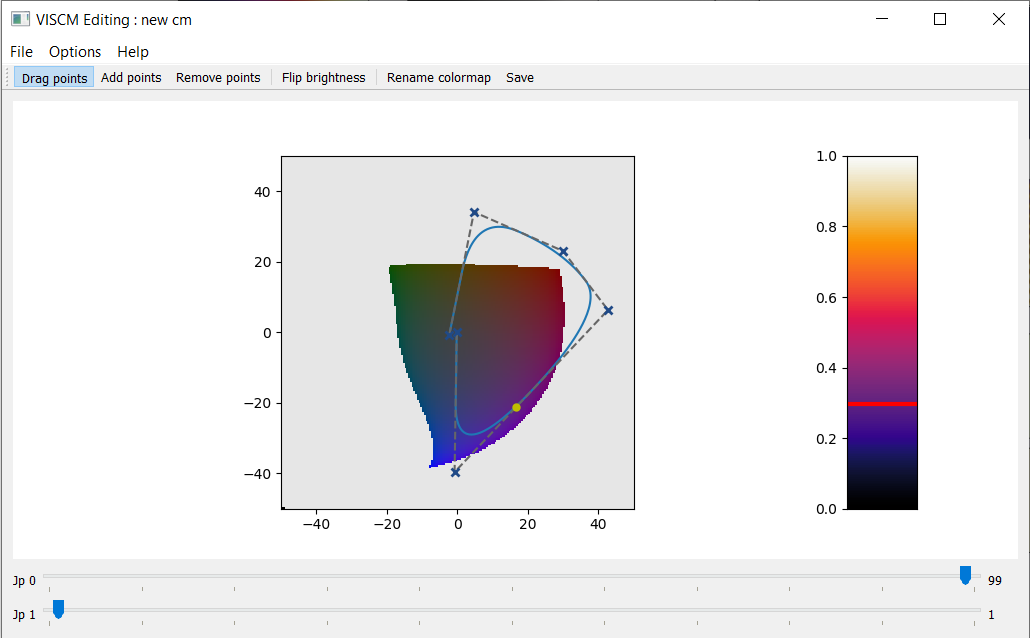
In finding the right colormap to use for a project, there is also the option of designing your own brand new colormap. This can be done though viscm like this, which opens up a user friendly editor.
python -m viscm edit
The search continues… ![]()
![]()